Duckweed Growth Rate: The Lab Number vs the Pond
Duckweed doubles in 1.34 to 4.54 days in vitro. Outdoors, one winter of ice collapsed the same population. What the growth rate really depends on.
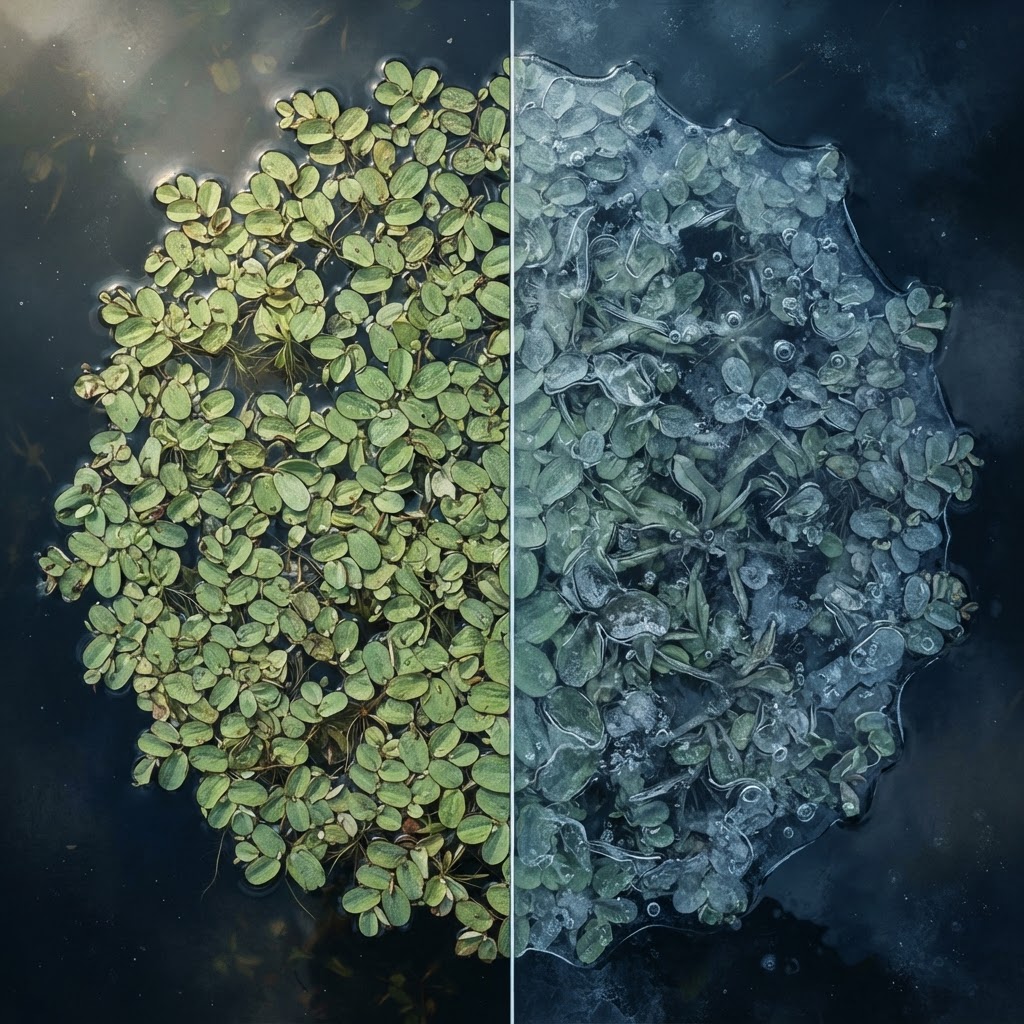
Ask what the duckweed growth rate is and you will get a number in seconds. Usually it is a doubling time of a day or two, quoted as a property of the plant, the way you would quote a boiling point. It is a real measurement. It is also a laboratory measurement, and the conditions attached to it are almost always dropped on the way to the page you read.
That matters if you are sizing a treatment step, judging whether a biomass supply can be consistent, or deciding which published figure is safe to build on. So this article does two things: it gives the number properly, with the conditions it was measured under, and then it shows what the same plant does outside.
The number you have probably read
The most careful version of the figure comes from a comparison of 39 clones spanning 13 species and all five duckweed genera, grown under standardised conditions. Across that set, relative growth rates ran from 0.153 to 0.519 per day and doubling times from 1.34 to 4.54 days, with relative weekly yields between 2.9 and 37.8.
Read that range again. The fastest clone in the study doubles more than three times faster than the slowest one, and both are duckweed. A single quoted doubling time has already thrown away most of what the measurement found.
The study is explicit that these are in vitro rates under standardised cultivation. That is not a criticism of the work. Standardising conditions is the only way to compare 39 clones against each other at all. It does mean the number answers the question “how fast can this clone grow when nothing is in its way”, which is a different question from “how fast will it grow here”.
What the same plant does outdoors
Outdoor data on duckweed over a full year is rare, which is why one recent study carries so much weight. Researchers ran open-air microcosms of 0.174 square metres in the Netherlands from spring 2017 to spring 2019, logging biomass, frond numbers, water chemistry and weather across two winters.
Two winters, two outcomes
The headline is not a rate. It is a pair of winters. In the first, the microcosms were covered by ice for roughly four weeks and the populations collapsed. In the second, which was warmer and produced no ice cover, the same populations held high abundance straight through.
Same site. Same species. Same experimental design. Opposite outcomes, decided by weather. No growth rate quoted as a plant property survives contact with that result.
At their peak the populations reached roughly 500,000 fronds per square metre and 190 grams of dry weight per square metre, so this is not a story about duckweed failing outdoors. It is a story about variance that a controlled environment removes by design.
The rates that survive the move outside
The same study measured growth without density dependence in freshly inoculated microcosms, under real outdoor conditions: 0.29 per day by frond number, 0.43 per day by fresh weight and 0.39 per day by dry weight. Those sit inside the in vitro range rather than below it, which is the useful surprise. Outdoor conditions did not simply make duckweed slower. They made it conditional.
And the variable that explained those rates best, in linear regression, was water temperature.
What actually moves the rate
A meta-analysis of the scattered literature on light, temperature and nutrients converts the evidence into working ranges, and it is the most practical starting point published.
Temperature
Growth peaks between 11.4 and 32.3 degrees Celsius. Outdoors that range is not a setting, it is a season. A site whose water spends four months below the bottom of it has a growth curve with a hole in it, and the ice-cover result above shows what the bottom of that hole can look like.
Light, measured as daily light integral
The same analysis places optimum growth at a daily light integral of 5 to 20 mol per square metre, and argues that daily light integral is a better parameter than photoperiod or intensity taken separately. That is a measurement-design point as much as a biology point: two sites can share a photoperiod and deliver very different light.
Nitrogen, phosphorus and the ratio between them
Growth is maximised above roughly 5 mg per litre of nitrogen and 1 mg per litre of phosphorus, with a recommended nitrogen to phosphorus ratio near 15 to 1. The outdoor study found the same theme from the other direction: across populations monitored year round, the nitrogen to phosphorus ratio was what best explained frond growth rate.
Density and the mat itself
A duckweed mat shades itself. The outdoor rates quoted above were deliberately measured without density dependence, in freshly inoculated microcosms, precisely because a mature mat behaves differently. Any figure taken from a full mat and any figure taken from a thin one are measuring different regimes, and neither is wrong.
Growth rate is not nutrient removal
This one deserves its own heading because almost nothing written for this audience says it. In Lemna, growth and phosphorus uptake can uncouple, which means the plant can be growing well while removing phosphorus at a rate you did not predict from that growth.
The practical consequence is direct. Sizing a duckweed wastewater treatment step on a growth figure alone is a design error, because the thing being sold is nutrient removal and the thing being measured is biomass. They are related. They are not the same number.
Which growth rate, measured how
There is one more trap inside the outdoor dataset, and it is easy to miss. Dry weight per frond was not constant through the year. It was highest in autumn and winter.
So frond count, fresh weight and dry weight are three different growth rates that drift apart seasonally. Counting fronds is not measuring biomass. A study that reports one and a vendor who reports another are not disagreeing, they are answering different questions, and comparing them directly produces a conclusion neither one supports.
This is the part of the problem SERAPH works on. Rather than sampling a tray occasionally and extrapolating, our vision system reads the canopy continuously: from a single capture it reconstructs the tray in 3D, drawing 170,000 surface points from 5.9 million captured, computes canopy volume, and already tells duckweed species apart in a live frame. Growth and stress reading are still in development.
We should be equally clear about where that leaves us. SERAPH is at TRL 3, proof of concept, with outdoor field validation still ahead. The reason we are building the measurement layer first is the gap this whole article describes: you cannot close a lab-to-field difference you are only sampling occasionally.
Species, or actually clone
One finding from the in vitro study is quietly more useful than the headline range. Relative growth rate did not vary primarily at the level of genus or species. It tracked the adaptation of the individual clone to its own local conditions.
The medium matters too. A comparison of Lemna minuta in its natural habitat against five synthetic growth media found the medium significantly changed relative growth rate in both frond number and surface area, along with protein, carbohydrate and pigment content.
Put those together and a growth rate quoted without its clone, its medium and its conditions is not a transferable number. It is a result. Which is also why choosing between Lemna minor and another species is a smaller decision than it looks, and choosing the right isolate for your water is a larger one.
How to read any duckweed growth number
Six questions to ask of the next figure you are handed, whether it comes from a paper or a supplier:
- Indoor or outdoor, and over what period.
- Which metric: frond count, fresh weight or dry weight.
- What water or medium, with its nitrogen and phosphorus.
- What temperature range, and what happened at the extremes.
- What light, ideally as a daily light integral.
- What density, and whether the measurement excluded density dependence.
A number that survives those six questions can be built on. A number that does not is still interesting. It just belongs to someone else’s conditions, which is the entire reason duckweed cultivation is designed rather than simply started, and why how duckweed is harvested changes what you measure next.
FAQ
How fast does duckweed double?
Under standardised in vitro conditions across 39 clones, doubling times ranged from 1.34 to 4.54 days and relative growth rates from 0.153 to 0.519 per day. Treat it as a laboratory range rather than a single figure, because the fastest clone in that set doubled more than three times faster than the slowest.
What temperature does duckweed grow best at?
Published evidence places maximum growth between 11.4 and 32.3 degrees Celsius. In outdoor microcosms, water temperature was the variable that best explained the growth rates actually measured.
Does duckweed survive winter?
It depends on the winter, and there is direct evidence rather than opinion. In the same outdoor microcosms, populations collapsed during a winter with about four weeks of ice cover, then held high abundance through the following warmer, ice-free winter.
Does faster duckweed growth mean faster nutrient removal?
Not necessarily. Growth and phosphorus uptake can uncouple in Lemna, so a system sized on a growth figure alone can miss its nutrient target even while the biomass looks healthy.
Why do published duckweed growth rates disagree so much?
Because the rate reflects the individual clone’s adaptation to local conditions more than its species, and the culture medium alone significantly changes it. Different clone, different medium, different number, with no contradiction between them.